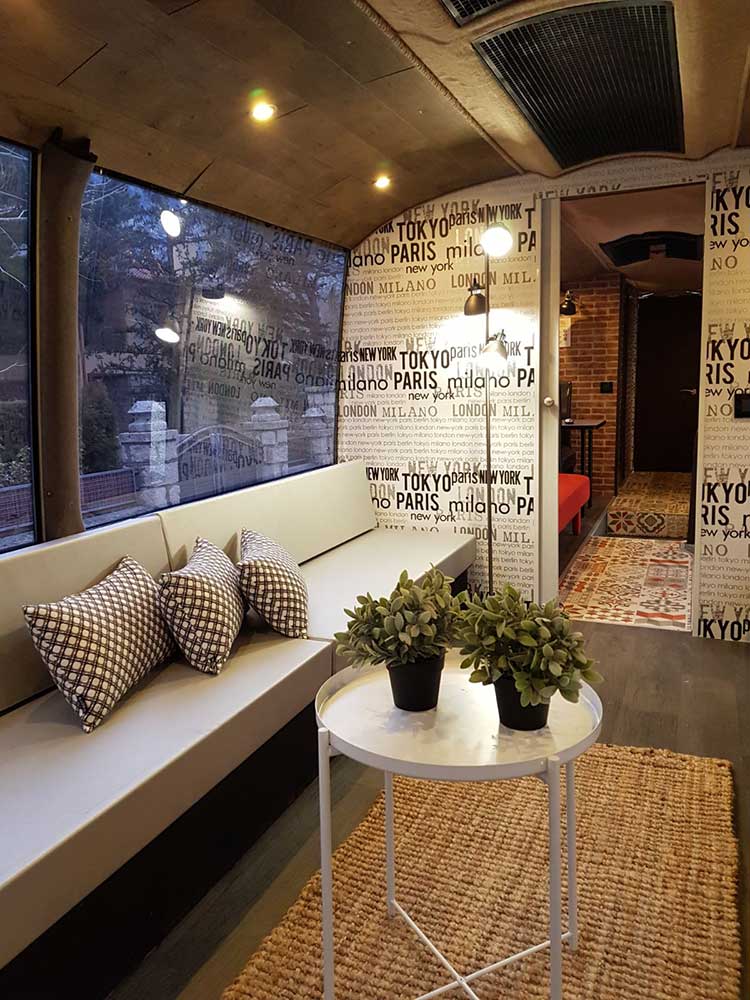
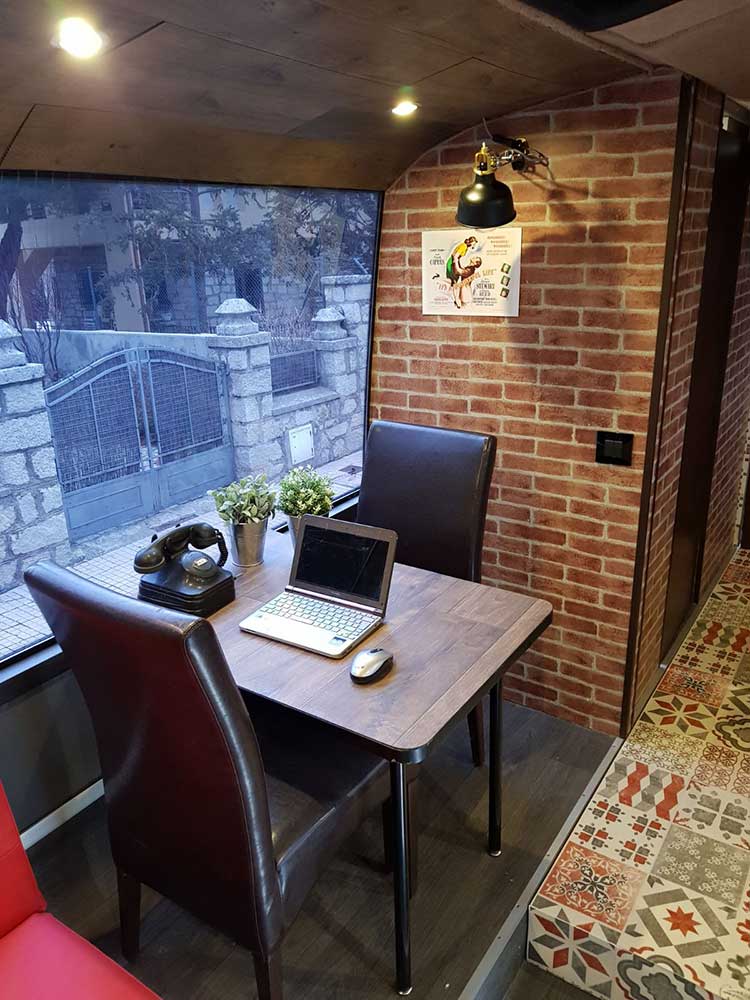
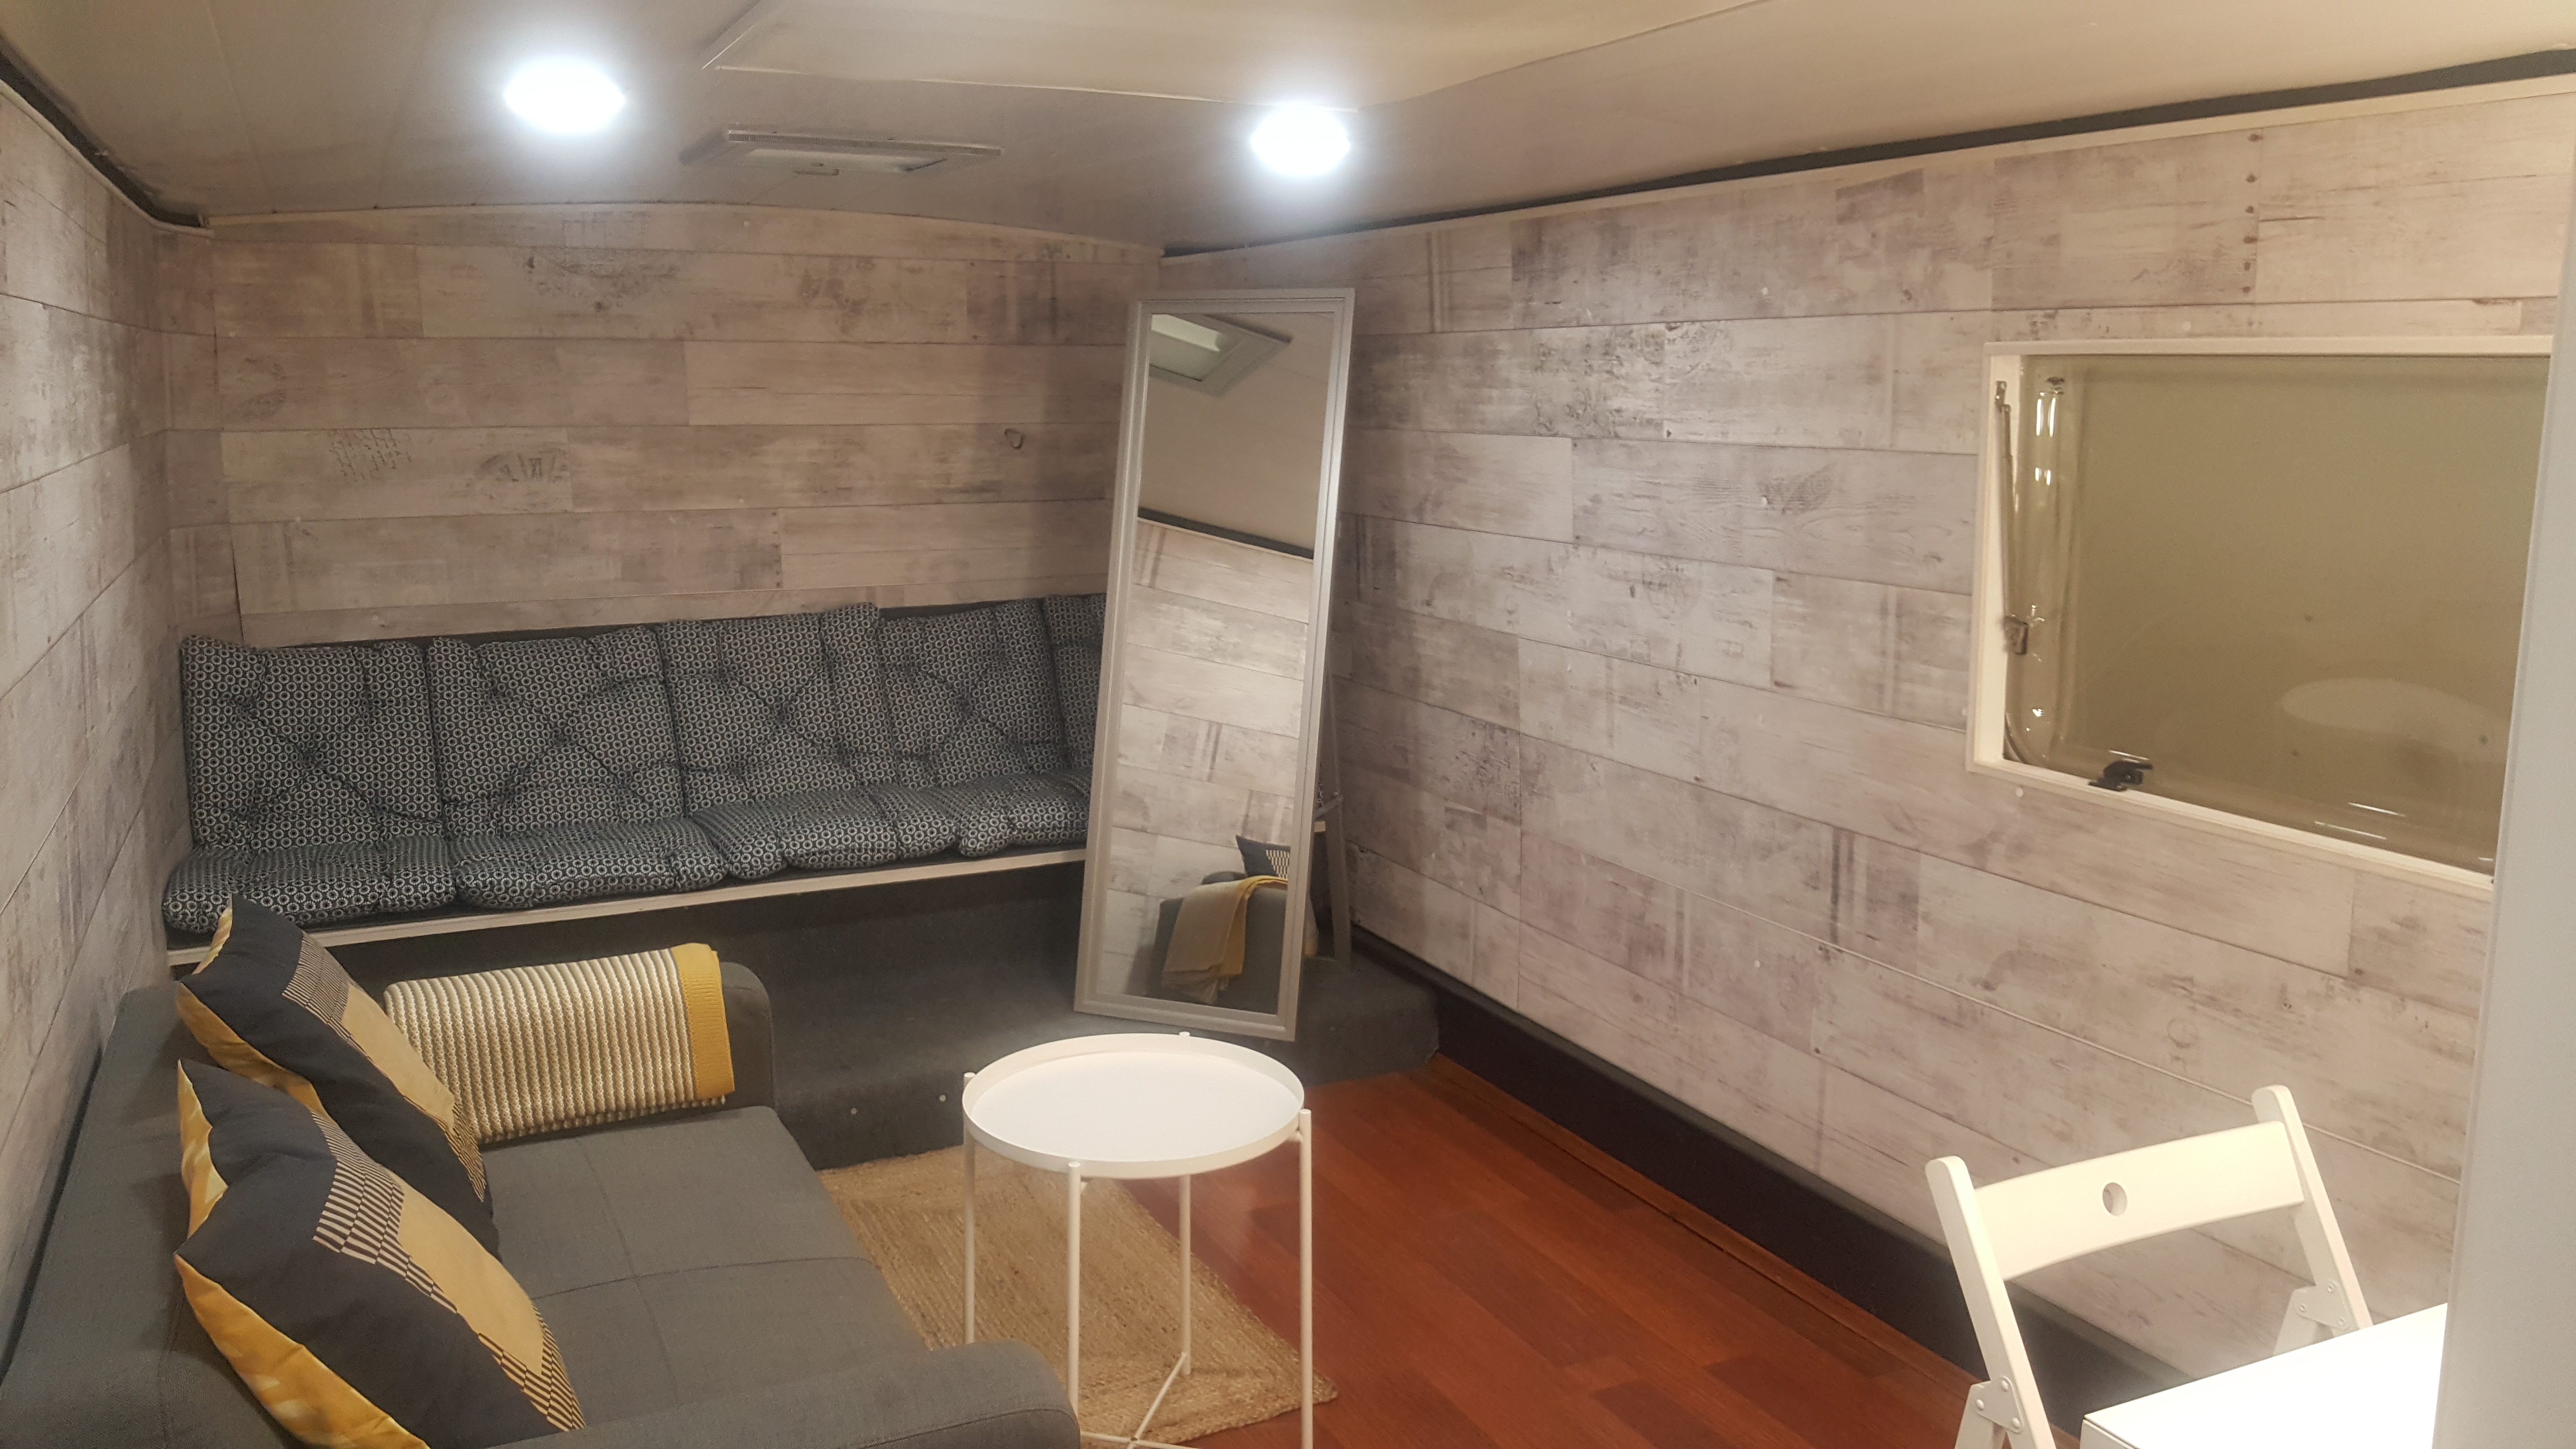
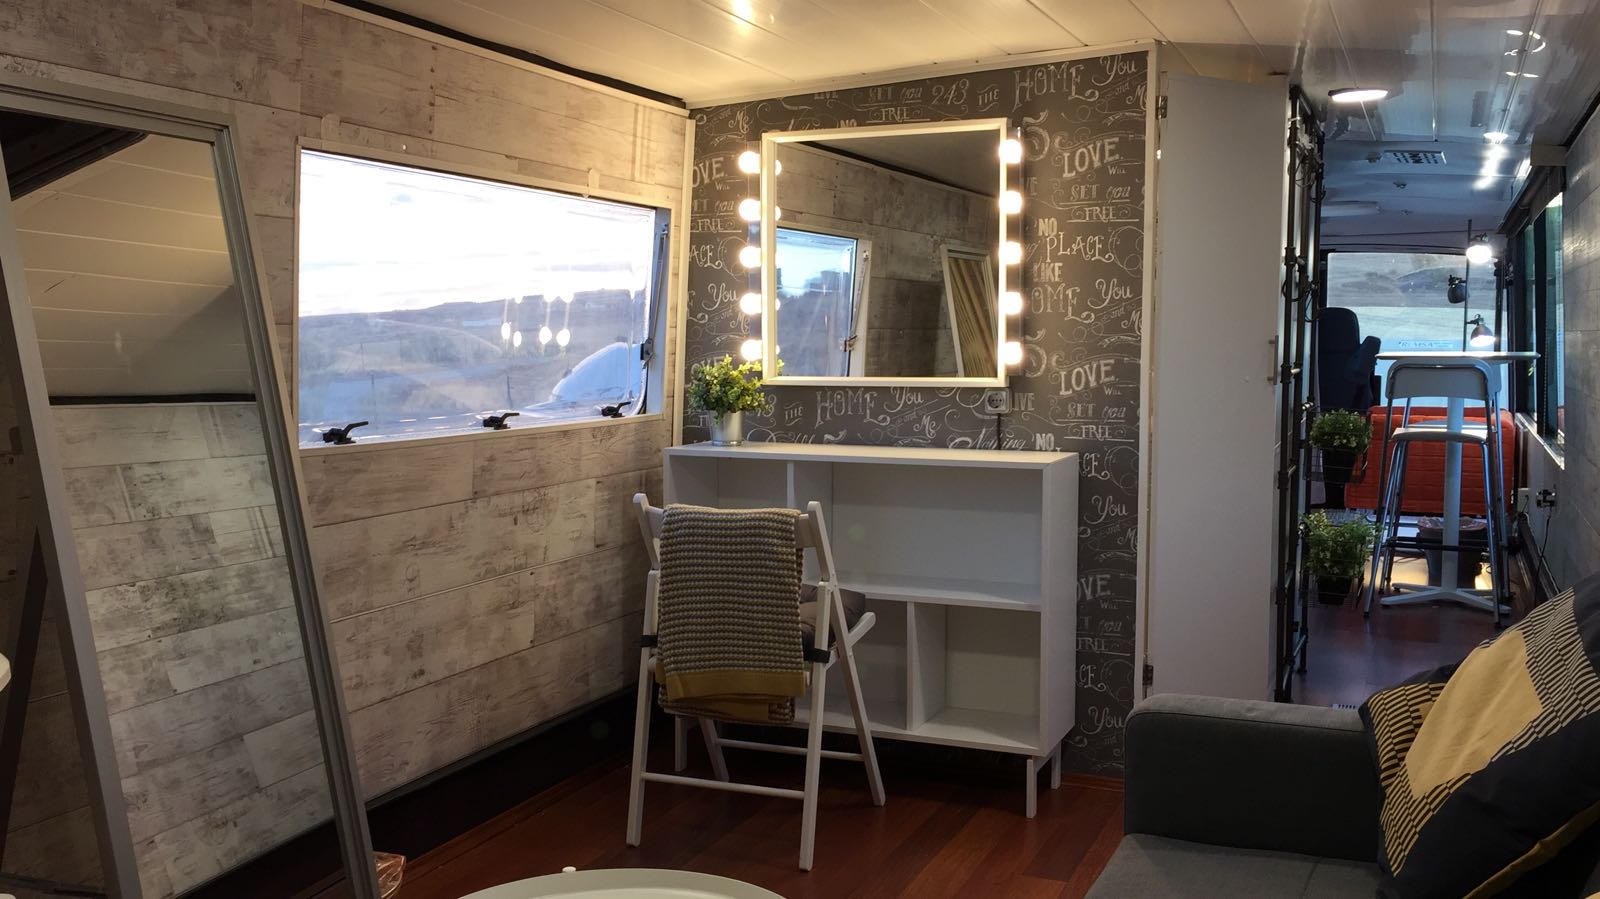
Mc Louis Glen 690 Sun Roller Ibis Autobús Multiespacio Autobús / Motorhome
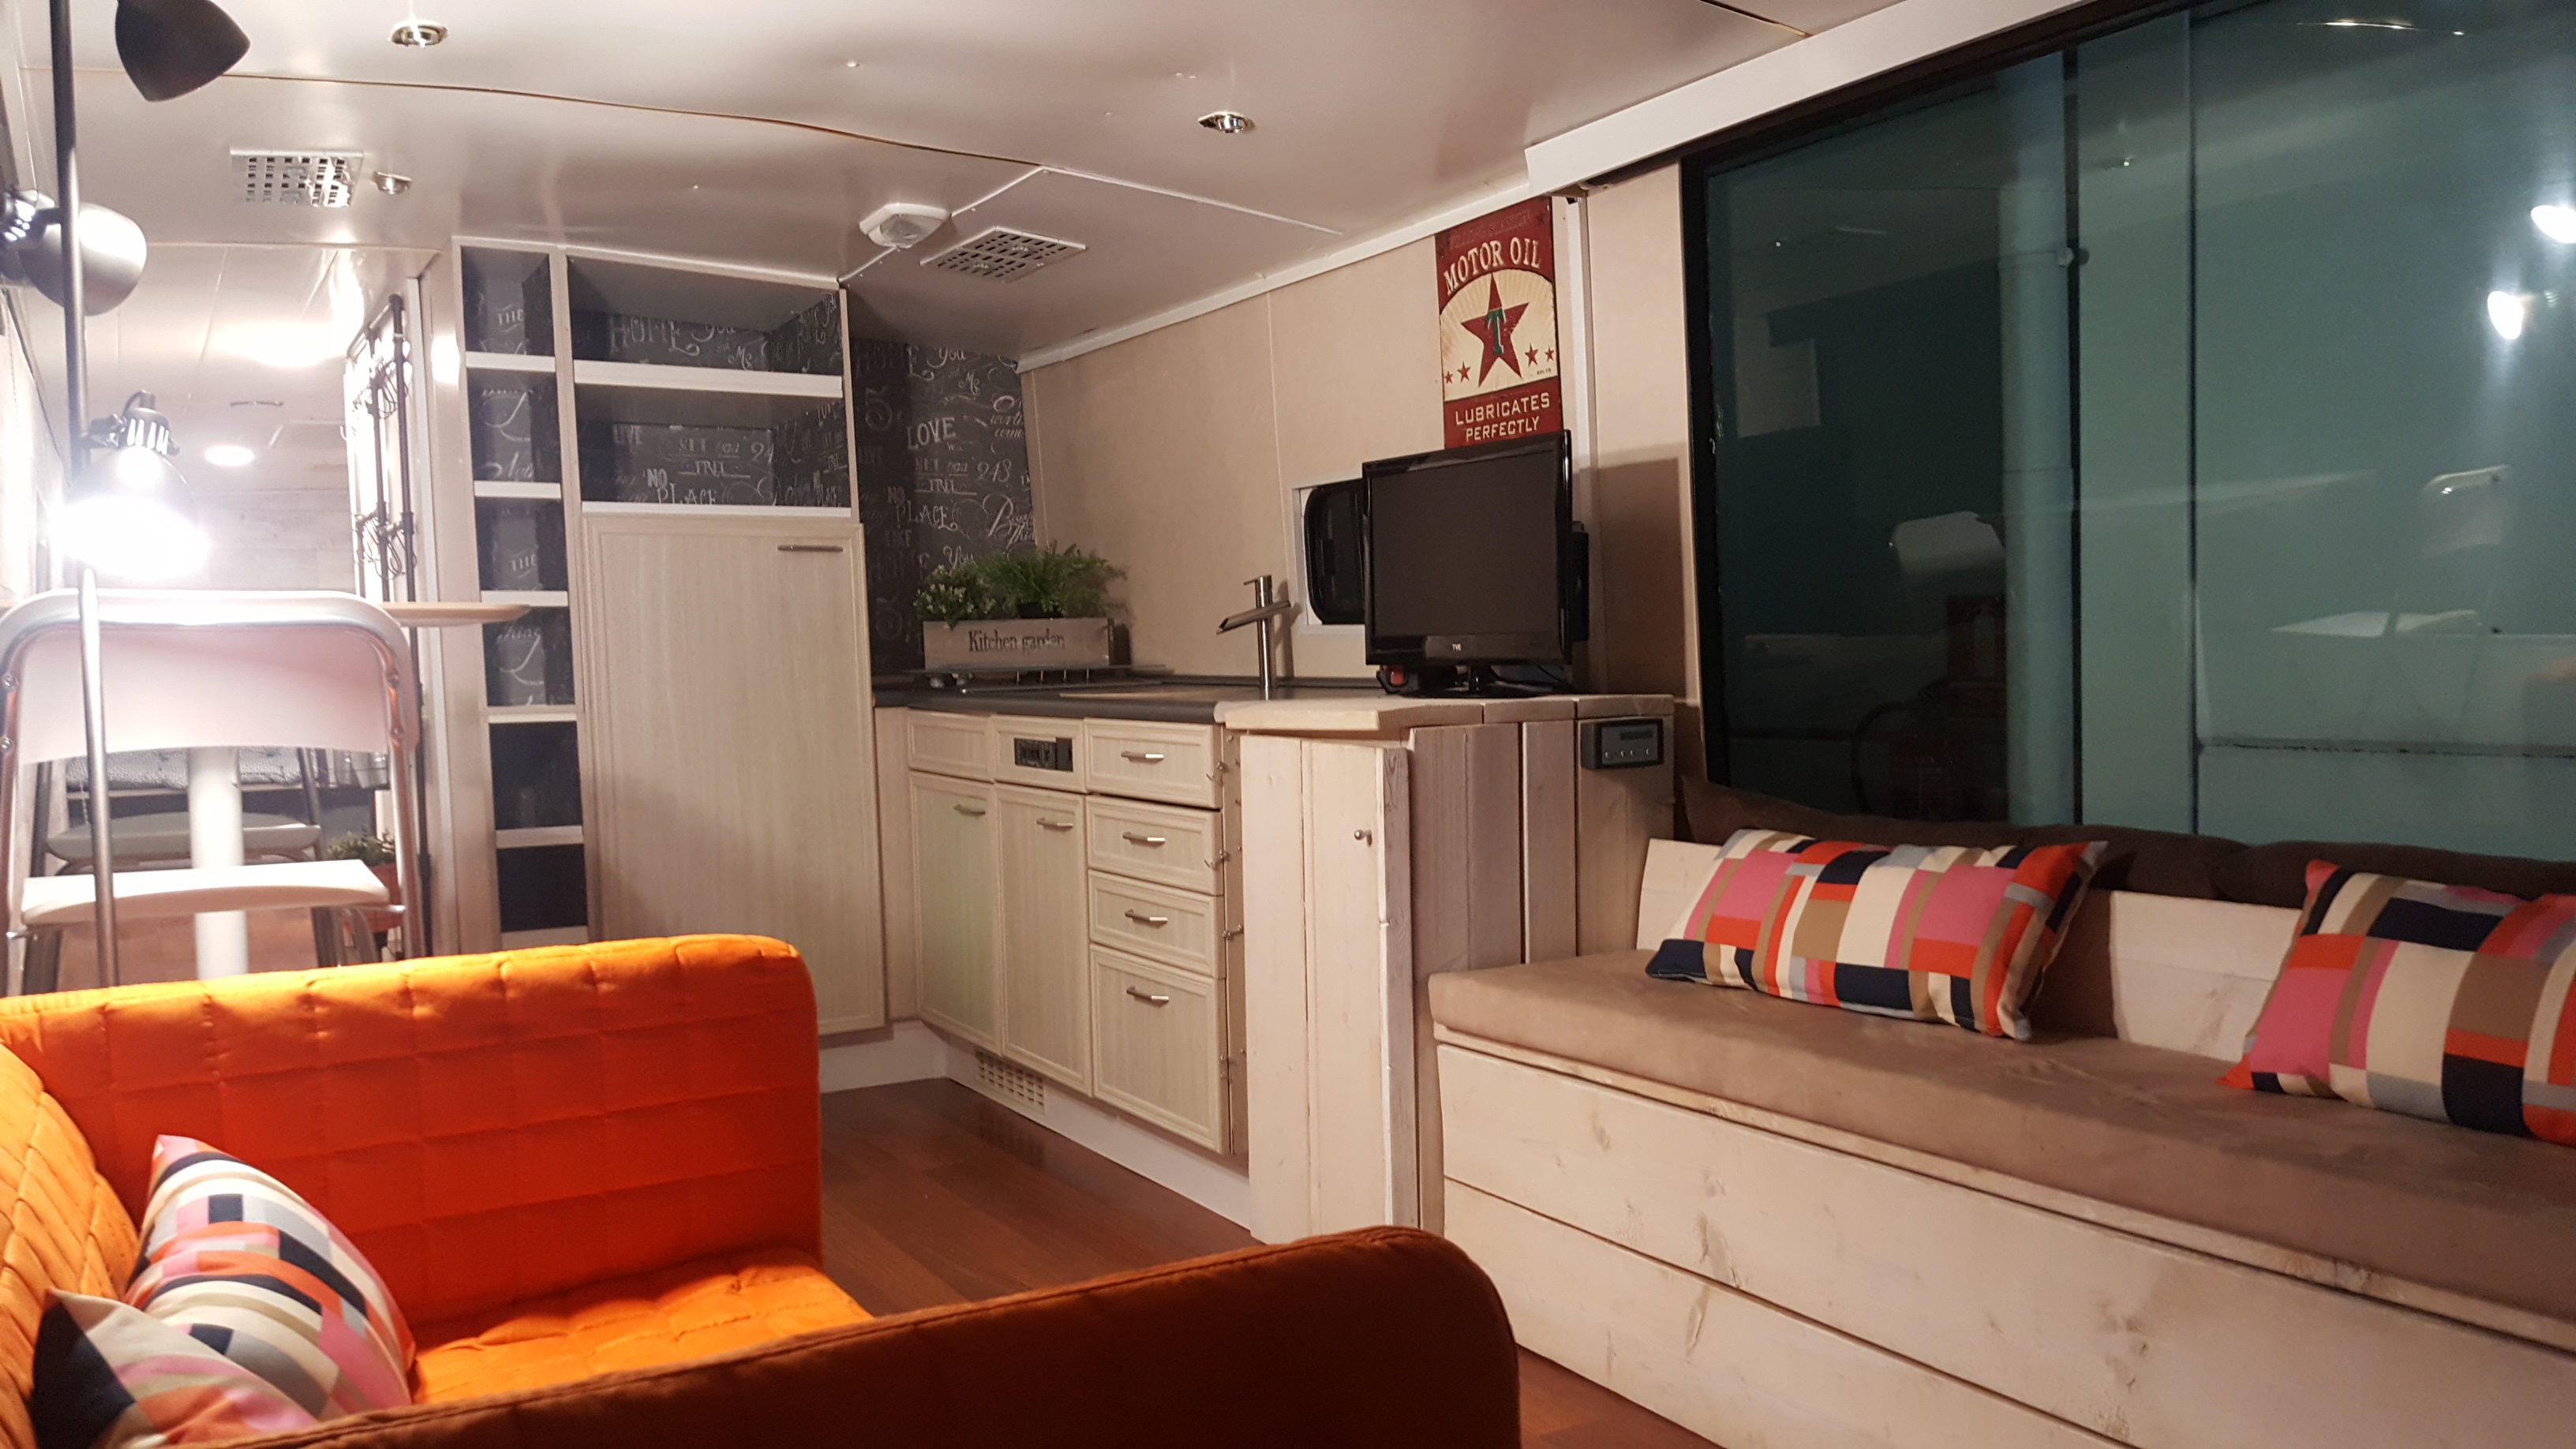
Baño con ducha separada Aire acondicionado Televisión y equipo de sonido Horno/microondas *más detalle en la descripción de cada vehículo
MantenimientoAtencion y resolución de cualquier incidencia
Para cualquier consulta info@classic-camper.es
Enric Villar Gómez | 686 663 222
Madrid, España
España y Europa